

To reduce the cost of pork production, high-fiber ingredients are often used in diets, but an increase in the amount of dietary fiber in pig diets may have a negative impact on the digestibility of nutrients and energy. Carbon footprint from pork production is related to emissions of greenhouse gases including carbon dioxide, nitrous oxide, and methane from pigs. Emission of gases may be correlated with the composition of feeds, and it is thus possible that feeding pigs with diets containing high-fibrous feed ingredients affects the gas exchange, which also impacts concentration of net energy (NE) in diets.
Therefore, the objective of this experiment was to test the null hypothesis that feeding pigs with a high-fiber diet does not affect gas production, N excretion, and NE in diets fed to group-housed pigs.
Experimental design
Two diets were used (Table 1). First diet was formulated based on corn and soybean meal (SBM) and contained 13.0% total dietary fiber (TDF). The second diet was based on corn and SBM and 33% wheat middlings and contained 21.8% TDF.
Twenty-four growing pigs (initial weight = 40.90 ± 1.72 kg) were allotted to one of the 2 diets using a 2-period switch back design with 6 chambers (4 pigs/chamber) and 2 periods. Therefore, there were 6 replicate chambers per diet. Each chamber was equipped with a slatted floor, 4 stainless steel fecal screens, and 2 urine pans for total, but separate, collection of fecal and urine materials. The temperature and humidity inside the chambers were controlled and maintained at the same levels in all chambers.
Pigs were allowed ad libitum intake of feed and had free access to water at all time. Total feces and urine samples were collected for 6 days on a time basis after 7-d adaptation. Total heat production (THP) was calculated using analyzed O2 consumption and CO2 and CH4 productions inside the chambers and N in urine. At 0700 h on d 14, pigs were deprived of feed for 36 h. This time was considered a fasting period to determine fasting heat production (FHP). Concentrations of digestible energy (DE), metabolizable energy (ME), and NE and the ATTD of dry matter (DM) and gross energy (GE) in diets were calculated.
Results
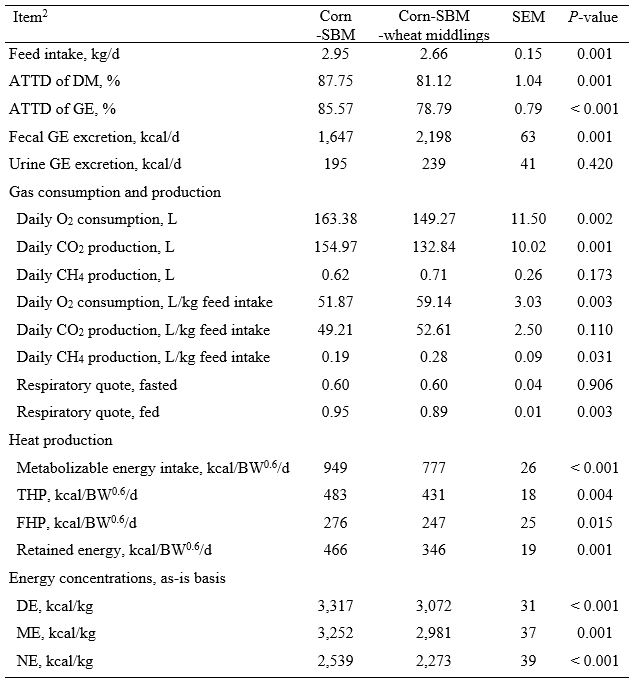
The ATTD of DM and GE were greater (P < 0.01) in the corn-SBM diet than in the wheat middlings diet (Table 1). Consumption of O2, CO2 production, and respiratory quotient were greater (P < 0.01) if pigs were fed the corn-SBM diet than if pigs were fed the wheat middlings diet. When corrected for daily feed intake, pigs fed the wheat middlings diet consumed more O2 and produced more CH4 (P < 0.05) than pigs fed the corn-SBM diet, but there was no difference in CO2 production between the two diets. Total heat production, FHP, and retained energy were greater (P < 0.05) in pigs fed the corn-SBM diet than in pigs fed the wheat middlings diet. Concentrations of DE, ME, and NE were reduced (P < 0.01) in the wheat middlings diet compared with the corn-SBM diet. Nitrogen intake, N in feces, absorbed N, the ATTD of N, retained N, and retention of N (% intake and % absorbed) were greater (P < 0.05) and N excretion in feces was less (P = 0.012) if pigs were fed the corn-SBM diet than if pigs were fed the wheat middlings diet (Table 2). In conclusion, feeding pigs with the high-fiber diet reduced NE in diet and gas production compared with the normal-fiber diet. However, the O2 consumption and CH4 production relative to feed intake of pigs were greater when pigs were fed the diet containing wheat middlings compared with the diet containing only corn and SBM.
Key points
- The ATTD of DM and GE, concentration of NE, and retained N are reduced and fecal N excretion is increased when 33% wheat middlings is included in diets fed growing pigs.
- When corrected with feed intake, consumption of O2 and production of CH4 are increased if diet contains wheat middlings, but production of CO2 is not affected by dietary fiber level.
Table 1. ATTD of DM and GE, heat production, gas consumption and production, and concentrations energy in diets fed to group-housed pigs (per one pig)1
1Least square means represent 6 observations per dietary treatment.
Table 2. Nitrogen (N) balance in diets fed to group-housed pigs (per one pig)1
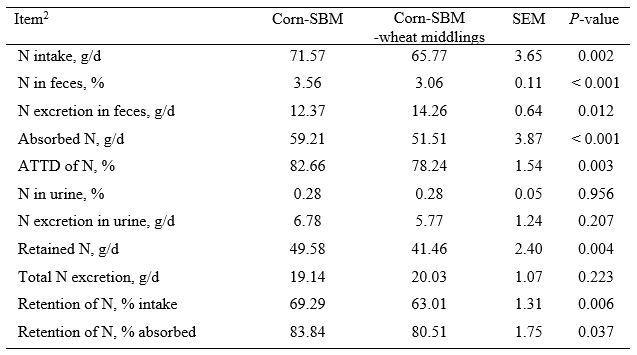
1Least square means represent 6 observations per dietary treatment.


