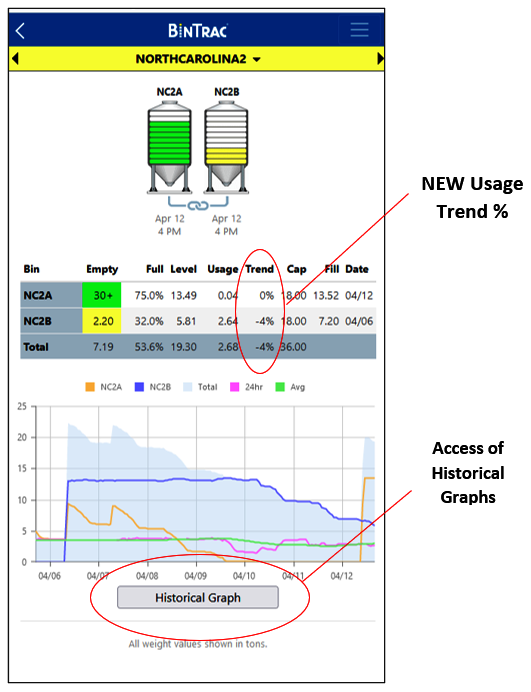
We are excited to announce a couple of NEW additions to the latest evolution of the BinTrac VISION Mobile experience.

NEW Historical Graphs are readily accessible
- Access the Link below the standard 7-day bin level/usage graph
- Selectable access to all available bins
- Selectable Days to Graph: 15,30,45,60,75,90,105,120
- Selectable # of Days Average Usage: 2,3,4,5,6, or 7 day
- Export to EXCEL hourly data over the selected date range
- Automatically displays graph data values of selected date and time
- Improved ZOOM feature of the historical graph with scrolling feature
- Formatted for easy viewing on any computer, tablet, or portable device
- Save/Print historical graph in several file formats: PNG,JPEG,PDF,SVG
- Selectable starting date of Historical Graph up to 12 months
- Viewing if 4 different units (Lb, Kg, Ton, Metric Ton)

| For more information on BinTrac VISION Mobile remote monitoring system, visit www.bintrac.com or contact your nearest dealer.
Please keep an eye out in the upcoming months for further updates as we continue to add more features to the BinTrac VISION experience in the future. |
|


